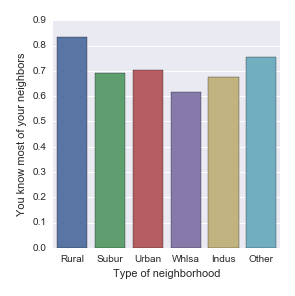
Social capital in urban, suburban and rural settings
Research shows adults and communities benefit from social connections. Less is known about teenagers, and whether neighborhood features foster such social capital.
Studies tell us that where teens live can make a difference in their educational success, risky behaviors and social interactions. Also, youth spend a lot of time outside at a formative time in their development.
So, do urban, suburban and rural settings play a role in building social capital?
In a national survey of 6,504 adolescents, respondents were asked if they knew most of their neighbors. Turns out, suburban teens were most likely to say they did not.
However, not all social familiarity is the same. Gangs too have high social capital.
Communities Data visualizations
by Patrick
Comments Off on Diverse neighborhoods really do make a difference
Diverse neighborhoods really do make a difference
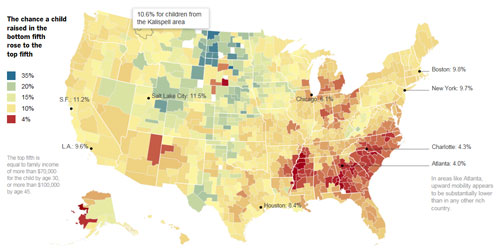
Image of upward mobility data visualization by New York Times
Community planners have long touted the benefits of diverse neighborhoods. And they employed lots of anecdotes along with targeted studies to spread their enthusiasm.
Now a study, released in 2013 and updated last year, pulls together millions of records to give researchers powerful new insights on what drives a person’s chances of rising above the station of their birth.
For the first time, there’s enough data to compare upward income mobility across metropolitan areas, according to the New York Times. This allows consideration of local factors in a deep way that previous studies could not do — like where people live.
The story says upward mobility tends to be higher:
- When poor families are more dispersed among mixed-income neighborhoods
- When there are more two-parent households
- With better elementary and high schools
- When there’s more civic engagement, including membership in religious and community groups
Also, the story says, while regions with larger black populations had lower upward-mobility rates, researchers’ analysis suggests this was not primarily because of race. For instance, both white and black residents of Atlanta had low upward mobility.
Be sure to check out the online story, if anything to probe the data visualizations.
Automobiles Commuting Data visualizations Travel
by Patrick
Comments Off on Where to find alternative fuel stations in Texas
Where to find alternative fuel stations in Texas
If you’re going to invest in an alternative-fuel vehicle, you might want to check where you can fill up. The city you’re in makes a difference.
For those relying on biodiesel, you’re good to go in Austin and not so bad in San Antonio, recent data from DriveBiodiesel.net shows.
Dallas has a broad mix of E85 and natural gas pumps, according to E85Locator.net and CNGLocator.net. Houston has a decent spread of E85 stations.
West Texas? One station, in Midland. Natural gas.
One thing’s for sure, if you want to take a road trip in an alternative-fuel vehicle, plan well. Some places will leave you with fumes.
Data visualizations Gas taxes Laws and policies Roads Transit
by Patrick
Comments Off on Texas drivers help pay tab for roads in other states
Texas drivers help pay tab for roads in other states
When you look at how much Texas drivers hand over to Washington and how much comes back, it’s easy to feel like the feds don’t like us much.
Federal officials do not “directly” return a whopping 78 percent of fuel and vehicle taxes collected in Texas. That’s second highest among states; behind Iowa with its 84% bye-bye rate and well ahead of third-place Florida.
Unfortunately, though, there’s a bigger untold story here. Officials invested more than half of those collections into projects straddling one or more states. And the data doesn’t show how those amounts were distributed among states.
So the 78% no-return likely isn’t as bad as it looks. Texas probably received more. Still, hover over the interactive map above and you’ll see a wide range of give and take, including Alaska’s 60 percent gain.
The data, from fiscal 2011, is the latest from the Federal Highway Administration. I saved it to a CSV file and used D3.js, with an assist from ColorBrewer.js and some custom javascript, to display it here. Have fun.
Texas road-rage accidents dashboard
When are drivers likely to lose their cool, to the point of rage?
I figured the hours after bars closed on weekends were the hot times. But that’s not true, according to a state road-rage database obtained by the Express-News.
I put together an online dashboard to query the database, which is hosted as a Google Fusion Table. It’s a great way to get a quick snapshot of layered filters, such as age, gender, ethnicity, days, times, etc.
Try it out below. For convenient side-by-side comparisons, click the “Compare Two Views” button under the dashboard.
I gleaned a few interesting insights myself.
Gas taxes Roads: Texas Department of Transportation
by Patrick
Comments Off on Texas replacing paved roads with gravel
Texas replacing paved roads with gravel
Usually, when a road is riddled with potholes, the solution is to patch or repave.
But in South Texas, where big trucks servicing the state’s latest oil boom are pulverizing pavement, the state’s answer is to tear up the asphalt and return the roads to gravel. Posted speed limits then have to drop from 55 mph to 30.
While the gas and oil boom is boosting state revenues by some billion dollars a year, the Texas Department of Transportation still largely relies on a two-decade old gas tax that inflation has cut in half. Lawmakers just can’t find the gumption to raise the tax, and don’t sound confident about other possibilities.
With the Legislature going into a special session to tackle the problem, KLRN TV’s Rick Casey lays out the issues in this 4-minute video. Here’s the text.
Automobiles Commuting Data visualizations Oil and gas prices Travel
by Patrick
Comments Off on Record high gas prices changing how Americans drive
Record high gas prices changing how Americans drive
With wild swings in gas prices pushing ever higher, U.S. drivers are slowly curbing their habits.
Regular-grade gas averaged more than $3.60 a gallon nationwide in 2011 and 2012. It’s never been so high, even when adjusted for inflation. The last records were set during the Iran hostage crisis three decades ago.
High prices, along with recessions, have tugged at America’s driving addiction, bringing down mileage in 1979 and again in recent years. But unlike gas prices, which can arc 40 percent in a year, driving habits die hard.
The difference jumps out when you juxtapose the data in a graphic. Mashing data like this can sometimes be confusing when you have two separate axes, but I think there’s an interesting pattern here.
Paying too much for car insurance?
If you’re in Texas, odds are you’re paying more for car insurance than the average U.S. driver, says a survey by Insure.com.
I ran the survey’s data through Google Fusion Tables to see a bigger picture, and it turns out costs are as varied as the nation’s landscape itself. In particular, extreme highs touch all three coasts as well as the Canadian and Mexican borders.
Hover over states to see average costs. The darker the shade, the higher the cost.
Reasons for the undulating costs are, literally, all over the map, from claim-happy and disaster-prone Louisiana and bumper-to-bumper traffic in Georgia, to slow-poke drivers in Iowa and strict teen-driving laws in Maine, according to Insure.com.
The survey looked at 2013 cars and settled on a typical guy with a clean record and good credit. Texas rolled in at $1,545, ranking 19th overall.
Texas joined 19 other states and D.C. to rank higher than the $1,510 national average. Louisiana tops the list with $2,699. Maine sits at the bottom with $934.
Here are the top 10. Again, use hover to see dollars. The full table’s here.
Travel
by Patrick
Comments Off on Bluebonnets along Texas highways expected to be spotty
Bluebonnets along Texas highways expected to be spotty
Wow. Look at this gorgeous rolling ribbon of road and bluebonnets.
This Texas Hill Country highway made msn.com’s top 10 scenic drives in the U.S.

Texas Hill Bluebonnet Tour, from msn.com's "10 scenic spring drives"
“If you want to see fields and fields of bright blue flowers resting atop a bed of emerald green grass, look no further than the annual Texas Hill Bluebonnet Tour,” it says.
But not all is so flowery.
“Wild about wildflowers? Too bad,” says an Express-News story posted yesterday, which lament’s this year’s spotty blooms.
Unlike last year’s lush bounty, fed by more than 10 inches of rainfall, this year’s blooms will be small and scattered due to just a third as much rain since Jan 1, according to the report. Meanwhile, look for the color to peak in early April.
Automobiles Commuting Data visualizations
by Patrick
Comments Off on Worst commutes in San Antonio
Worst commutes in San Antonio
San Antonio commuters spend an average of 23 and a half minutes getting to work, the latest federal data show.
Nothing shattering. In fact, it’s about two minutes less than the national average.
But what surprises me are some of the zip codes with the longest commutes.
Before seeing the U.S. Census data mapped out recently by a team at WNYC in New York, I figured commuters with the longest slogs tended to live in areas swaddling Loop 1604 on the North Side and exurbs like Boerne and New Braunfels.
In the map above, the beleaguered U.S. 281 corridor shows up as expected. But South Loop 1604 looks worse than its northern leg. And look at the bruised ring of satellites to the west and south.
A concentration of jobs on the North Side, along Loop 1604 and interstates 35 and 10, is likely sucking in many of these commuters from counties on all sides. The pull is stronger and wider than than I had realized.
You can hover over zip codes to see average commute times. You can also slide the map to see other cities, and zoom out to see other states. Here’s a full-page version.
Note that these stats include transit, walking and bicycling. But in a car town like San Antonio, despite volatile gas prices the past five years, nine out of 10 people still drive or carpool to work. Here’s a breakdown.