Data visualizations Laws and policies
by ptdriscoll
Comments Off on What drives income inequality?
What drives income inequality?
If we agree that too much wealth in the hands of too few stymies the economy, and even democracy, what do we do?
With the middle class losing ground despite healthy corporate profits, politicians and pundits gladly harp on tax rates, migrant populations and other soft targets to prescribe solutions for growing income disparities.
I decided to see what the data says.
Using World Bank datasets, I analyzed more than a dozen factors to see how they might relate to income distribution, defined here as share of income held by a country’s top 10 percent of earners.
After tabulating 15 measures from 2005 to 2014, and removing empty values, I was left with 102 countries to compare. Share of income in the wealthiest tier ranged from 20.6% to 52.3%, and averaged 30.7%. Top U.S. earners shared 30.1% of income, which was just below the average.
An algorithm spit out 10 factors that explain 58.6% of the differences in income distribution among countries. That’s decent enough to start conversations.
Here are all the factors, grouped and ranked by their relationships with income inequality. The table shows regression coefficients – the farther a number is from 0, the stronger the positive or negative correlation.
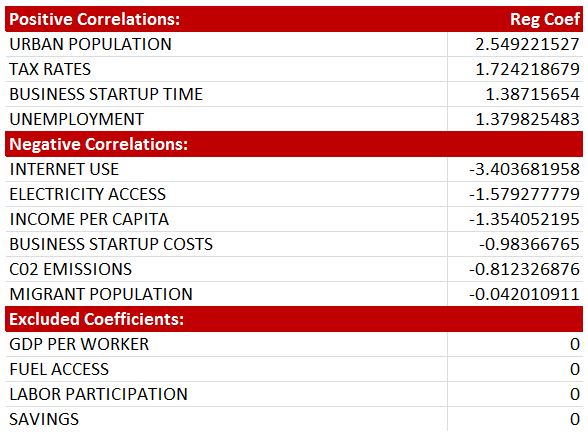
Results show that business climates may play a role in how much wealth flows to or remains in the hands of the rich. When tax rates are high and entrepreneurs face barriers starting businesses, income inequality is higher. These factors, also associated with high unemployment, might limit opportunities and slow economic growth.
However, when earnings, startup costs and c02 emissions are higher, income is distributed more evenly. These factors could be byproducts of robust investments and business activities. In addition, key resources such as the Internet and electricity may be important tools to spark the economy and help level incomes.
In the U.S., tax rates and earnings are near the top, while time and cost to start a business are near the bottom.
Some results should give pause to recent political rhetoric. For example, while higher unemployment is associated with higher income inequality, a larger migrant population is not.
This study also points to areas where we can look deeper, such as impacts from large urban areas. Many other factors in the World Bank’s dataset, not looked at here, could also be significant. I wanted to also look at college graduation and literacy rates, technology research and government debt, but missing values in the data would have shrunk the pool of countries even smaller.
To conduct the analysis, I used the Python scikit-learn library to do lasso and least-angle regression with 10 steps of cross validation. Lasso and LARS is a supervised machine-learning process that selects relevant explanatory variables. To create the interactive bar graphic, I used D3.js, a JavaScript library.
Here’s the full study: